<< Previous | Outline | Next >>
Establishing Loads: An example
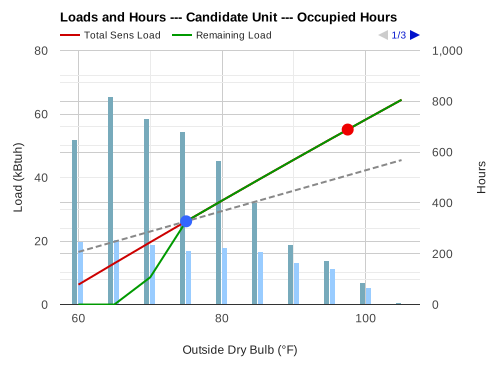
- Red line: total sensible load (SLD)
- Green line: sensible load after economizing (SLdE)
- Gray dashed line: non-ventilation sensible load (NVSLd)
- Steel-blue bars: total hours in each bin
- Light-blue bars: scheduled hours of operation (Hrs)
- Blue dot: set point
- Red dot: design condition
- Economizer
- Sensible load is reduced by fully opening the outside-air damper and running the supply fan at full speed.
- Hours of operation from weather tapes
- Schedule acts as filter
- Binned by dry-bulb (with coincident wet-bulb)
Discussion:
Fan capacity, not used in ventilation, can optionally be used in economizing the load. The economizer reduces the sensible load, at outdoor temperatures below the setpoint, by fully opening the outside-air damper and bringing in additional ventilation air. When economizing, the supply fan runs at full speed.
In the example chart (produced by the Bin Method Calculator) for Wichita, the "After Economizer" trace shows the final load data that will drive the run-time calculation (this trace is reduced to zero for those bins where the economizer can satisfy all the cooling load).
For temperature bins where the economizer cannot satisfy the load on its own, supplemental DX cooling is modeled in the calculator in what is called integrated mode (see the 70F bin in Wichita chart). In this mode, the unit balances the load against the two cooling sources to determine how much DX runtime is needed in the hour. During the economizer-only portion of the hour the fan runs at full speed. During the DX-only portion of the hour the fan runs at full-speed for a single-speed system. However, for a variable-capacity unit, the DX-only portion of the hour runs at a fan speed that corresponds to the first-stage of a staged unit or the minimum capacity of a unit with a variable-capacity condenser.
The final step in presenting the load data to the unit is to determine the number of hours in which the unit experiences that load. In the example chart for Wichita, with a schedule of Monday - Friday, 7am - 7pm, the hour distribution, as binned by outside temperature, is shown with the light-blue bars. These bars are labeled "Scheduled Hours." The potential total hours, as would be the case if no schedule were filtering the hours, is shown by the steel-blue bars, labeled "Total Hours." The total hours are displayed as a reference to give the user a sense of the filtering applied by the schedule. When an "All Day, All Week" schedule is selected, these two sets of bars (filtered and unfiltered) are identical, same height, side by side.
When considering how unit performance varies from city to city, it is useful to keep in mind that the building-load model (in this case: "Office-Medium") is scaled to match the capacity of the candidate unit at design conditions. As a result of this explicit balance, design temperature is not by itself a primary driver of energy usage, but rather two associated weather characteristics have more impact:
- Hour count in the cooling bins (longer cooling season means more energy use).
- The skew of the hour distribution (the more skewed toward high temperatures, the more time at high load and low capacity; the result is longer run times per bin hour).
The Bin Method Calculator reports calculation results for any temperature bin where there is a positive cooling load (before economizer reductions).