<< Previous | Outline | Next >>
Equipment Response To Loads
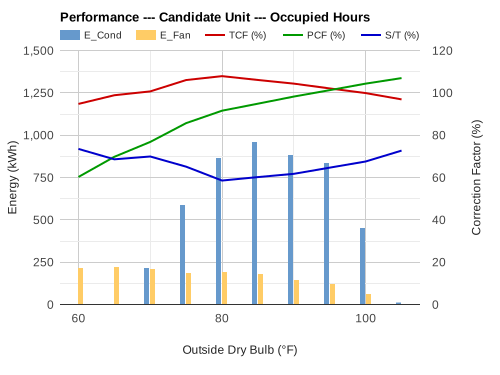
This chart of equipment performance is generated when the "Show bin calculations" option is selected. The chart data is from five of the columns in the bin-calculations tables.
- Red line: Total capacity Correction Factor (TCF)
- Green line: Power Correction Factor (PCF)
- Blue line: Sensible to Total capacity ratio (S/T)
- Blue bars: Condenser energy consumption (E_Cond)
- Gold bars: Evaporator fan energy consumption (E_Fan)
Modeling the unit's response to the cooling load starts with corrections to the total gross (full-load) capacity as affected by outdoor and mixed-air conditions and evaporator fan air-flow rate. This is followed by solving for the condenser runtime or doing an iterative search for the condenser capacity level at which the RTU's sensible capacity balances the sensible cooling load. Once the run times (or capacity levels of staged or variable capacity units) are determined, fan energy and condenser power levels are established and corresponding energy usage is calculated.
This outline provides a high-level description of this sequence of steps:
- Entering (coil) conditions are determined with a mixed-air calculation based on ventilation rate and economizer usage.
- Capacity Corrections:
- Total capacity is calculated as corrections to gross AHRI rated capacities as affected by environmental conditions (outdoor dry-bulb, and entering wet-bulb and dry-bulb). Corrections can be in one of three forms: (1) Generic DOE-2 corrections curves, (2) Spreadsheet-based correction curve, and (3) Specific manufacturers' corrections as selected by the "Specific Candidate Unit" feature.
- Sensible capacity is calculated using the apparatus dew-point bypass factor method. Outside temperature, mixed-air temperature and wet-bulb affect the estimate of sensible capacity. For staged and variable-capacity system, capacity level and fan-speed level also affect these calculations. (Note that the spreadsheet interface supports regression modeling of the sensible-to-total ratio data as provided in manufacturers' data. However, capacity level and fan level effects on S/T are not considered if S/T data is supplied with the spreadsheet.)
- Load balance between sensible capacity and sensible load can be calculated for three types of RTU:
- Single-stage system: The unit runs for part of the hour (cycles).
- Multiple-stage systems: As a multi-stage unit attempts to match its capacity to the cooling load it will progress from lower to higher stage capacities. This search for balance starts with its first stage, then steps through pairs of intermediate stages, and potentially ending at its highest stage level. During times of intermediate load levels, the lower stage level (of the stage pair) and the associated compressors that comprise it, run the whole hour. The difference between the two levels in the stage pair (a single compressor) runs part of the hour (cycles) and its performance is degraded according to run-time fraction.
- Variable-capacity compressors: Through an iterative calculation, the unit's compressor capacity and fan flow are adjusted to balance the sensible capacity with the sensible load.
- Condenser-power corrections:
- Full-load corrections are made to the rated efficiency as affected by environmental conditions. In a process that mirrors the correction methods for capacity, full-load condenser power corrections are made based on the efficiency and capacity corrections.
- Part-load corrections:
- For systems that cycle, degradation is calculated using a linear relationship depending on the user specified "Degradation Factor."
- For systems with variable-capacity condensers, as the system unloads, the compressor power scales down in proportion to the capacity, and the condenser fan power follows fan-affinity laws. The variable-speed system does not need to cycle and therefore has no part-load degradation.
- (Note that the spreadsheet interface provides a polynomial-regression model of condenser power as a function of load fraction and outside dry-bulb. This can be used to model fixed or variable capacity systems.)
- Evaporator fan power:
- Full-load evaporator fan power can be specified on the Controls page or the default value can be used as determined by the unit's rated total capacity. The following linear relationship is based on a survey of RTUs: Power_FullLoad = (0.0132 * TotalCapacity_kBtuh) - 0.2283.
- Part-load corrections:
- Single-speed fans run at the same speed (and power) whenever they are on.
- For multi-speed fans, affinity laws are used to estimate fan-power draw at part-load conditions. The fan-flow rate scales with capacity as the unit unloads.
Power_PartLoad = Power_FullLoad * ((CFM_PartLoad)/(CFM_FullLoad))^n, where n has a default value of 2.5 but can be specified on the Controls page.
Discussion:
The following comments discuss algorithmic details in the calculation engine:
- The calculator accounts for fan savings of evaporator and condenser fans that change speeds as capacities change. For systems with a variable-capacity compressor, both the evaporator and condenser fans will operate at reduced power levels. For staged systems, only the evaporator fan reduces speed; the condenser fans turn on/off as their corresponding compressor turns on/off. Reduced fan speeds correspond to reduced fan power. For example, a fan running at half speed will operate at 1/8th power if a fan-affinity law where n=3 is used (e.g. (1/2)^3 = 1/8). The n value can be changed by the user on the calculator's Controls page. For systems with condenser fans that change speed, the fraction of the condenser power at test conditions must be known (or estimated) to facilitate the calculation.
- With version 4.3 comes improved modeling of the sensible capacity of the unit as affected by flow changes. This means the calculator is now representing row-split units (evaporators in series) and therefore a single-speed fan on a two-stage unit will yield a much more sensible first stage (this makes it more efficient in terms of satisfying the sensible load as governed by a sensible thermostat). These flow effects are also visible for higher multi-stage and variable-speed compressor systems. They become more sensible as they run at lower condenser capacities (and fan flows).
- The Advanced Control retrofit (an option available under the "Specific Candidate Unit" feature) acts to reduce the speed of a single-speed evaporator fan. When this option is selected, fan-related corrections to gross-total capacity and efficiency are made based on the fan-speed fraction (relative to rating conditions). These are the standard flow-driven correction curves that are part of the DOE-2 set of curves. These corrections have a relatively small impact on savings calculations for the Advance Control retrofit with less then a 1% reduction in overall savings.
- Modeling of the Advanced Control retrofit unit in the calculator indicates a small condenser penalty (negative condenser energy savings). This is because the reduced fan speeds make the unit less sensible (more latent because the coil is colder) and so there is more condenser runtime needed to satisfy the sensible load. There is some supporting evidence of this in field assessment data. This is indicated in the field data by overall unit savings that are less than the fan savings. However, it is important to note that the evaporator-fan energy savings are much larger than the condenser penalty, so there is clearly a net benefit to the Advanced Control retrofit.
- Integrated-economizer cases (temperature bins where economizer cooling must be supplemented by DX cooling) are processed so that when the DX is on, the fan speed corresponds to the capacity fraction of the unit. This approach attempts to satisfy the load by running part of the hour in economizer-only mode (high-fan speed) and part of the hour in DX-only mode. If first-stage DX (or minimum capacity of a variable speed system) can't sufficiently supplement the economizer, then the attempt at integrated operation is replaced by a normal DX analysis (no economizer). This reflects the fact that at higher stage levels for staged systems (or at capacity levels above the minimum capacity for units with variable capacity condensers) the DX runs the whole hour.
- The calculation engine prevents any variable-speed system from operating in variable-speed mode below 15% of capacity. When a variable speed system operates below the 15% limit it does not run the full hour. Instead, a run time is calculated using the 15% minimum.